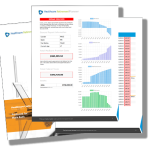
Product profitability analysis is a financial evaluation process that helps businesses understand the profit contribution of individual products or product lines. By analyzing the costs and revenue associated with each product, businesses can make informed decisions about product pricing, resource allocation, and inventory management.
Key Elements of Product Profitability Analysis
Revenue Analysis: This involves calculating the revenue generated by each product, considering factors like pricing, sales volume, and any discounts. Accurate revenue tracking per product or product line is essential to understanding overall profitability.
Direct Costs: Direct costs are expenses that can be directly attributed to a specific product, such as raw materials, labor, packaging, and manufacturing costs. These costs fluctuate with production volume and are crucial for calculating the gross profit margin of each product.
Indirect Costs (Overhead): Indirect costs, or overhead, include expenses that are not directly linked to a specific product but are necessary for overall operations, like rent, utilities, and administrative expenses. Allocating overhead appropriately to each product can be challenging but provides a clearer view of each product’s true profitability
Gross and Net Profit Margins:
- Gross Profit Margin measures profitability by considering revenue minus direct costs and shows how efficiently a product generates profit before indirect costs.
- Net Profit Margin includes all costs—both direct and indirect—offering a complete view of a product’s profitability. Net profit margin helps identify which products are financially sustainable in the long run.
Benefits of Product Profitability Analysis
- Informed Pricing Decisions: By understanding product-level profitability, companies can adjust prices to ensure a healthy profit margin or identify unprofitable products that may benefit from a price increase.
- Optimized Product Portfolio: Profitability analysis helps companies identify high-performing products, discontinue low-performing ones, and shift focus to more profitable items.
- Improved Resource Allocation: Knowing which products contribute most to profitability helps businesses allocate resources efficiently, maximizing return on investment (ROI) for each product line.
Methods of Product Profitability Analysis
- Activity-Based Costing (ABC): ABC allocates overhead costs based on the specific activities that each product requires, making it more precise for multi-product companies. It identifies the true cost of producing a product by considering indirect costs like maintenance and equipment.
- Contribution Margin Analysis: This method focuses on the revenue remaining after variable costs are subtracted. It helps determine how much each product contributes to fixed costs and profitability.
- Break-Even Analysis: Break-even analysis identifies the sales volume at which a product starts generating profit. It’s an essential tool for determining pricing strategies and understanding profit potential.
Challenges
- Data Complexity: Collecting and analyzing data for every product, including direct and indirect costs, requires robust data management systems.
- Allocation of Overheads: Accurately allocating overhead costs across products is often difficult but necessary for true profitability insights.
- Market and Price Sensitivity: Prices and costs can fluctuate due to external factors, such as raw material costs or changes in customer demand, which can impact profitability.
Tools and Software
Software tools such as SAP, Oracle NetSuite, and QuickBooks offer modules for product profitability analysis, including activity-based costing and contribution margin tracking. These tools simplify data collection, integration, and reporting, helping companies make data-driven profitability decisions.
In summary, product profitability analysis is essential for understanding a product’s financial performance, enabling businesses to adjust strategies, optimize product portfolios, and maximize profitability.
Doing a product profitability analysis for your business may be overwhelming. However, there are many tools available that can do this for you. One of the top tools that can help you with this is Connect Books. Check out Connect Books and how it can help you and your business at https://www.connectbooks.com/

